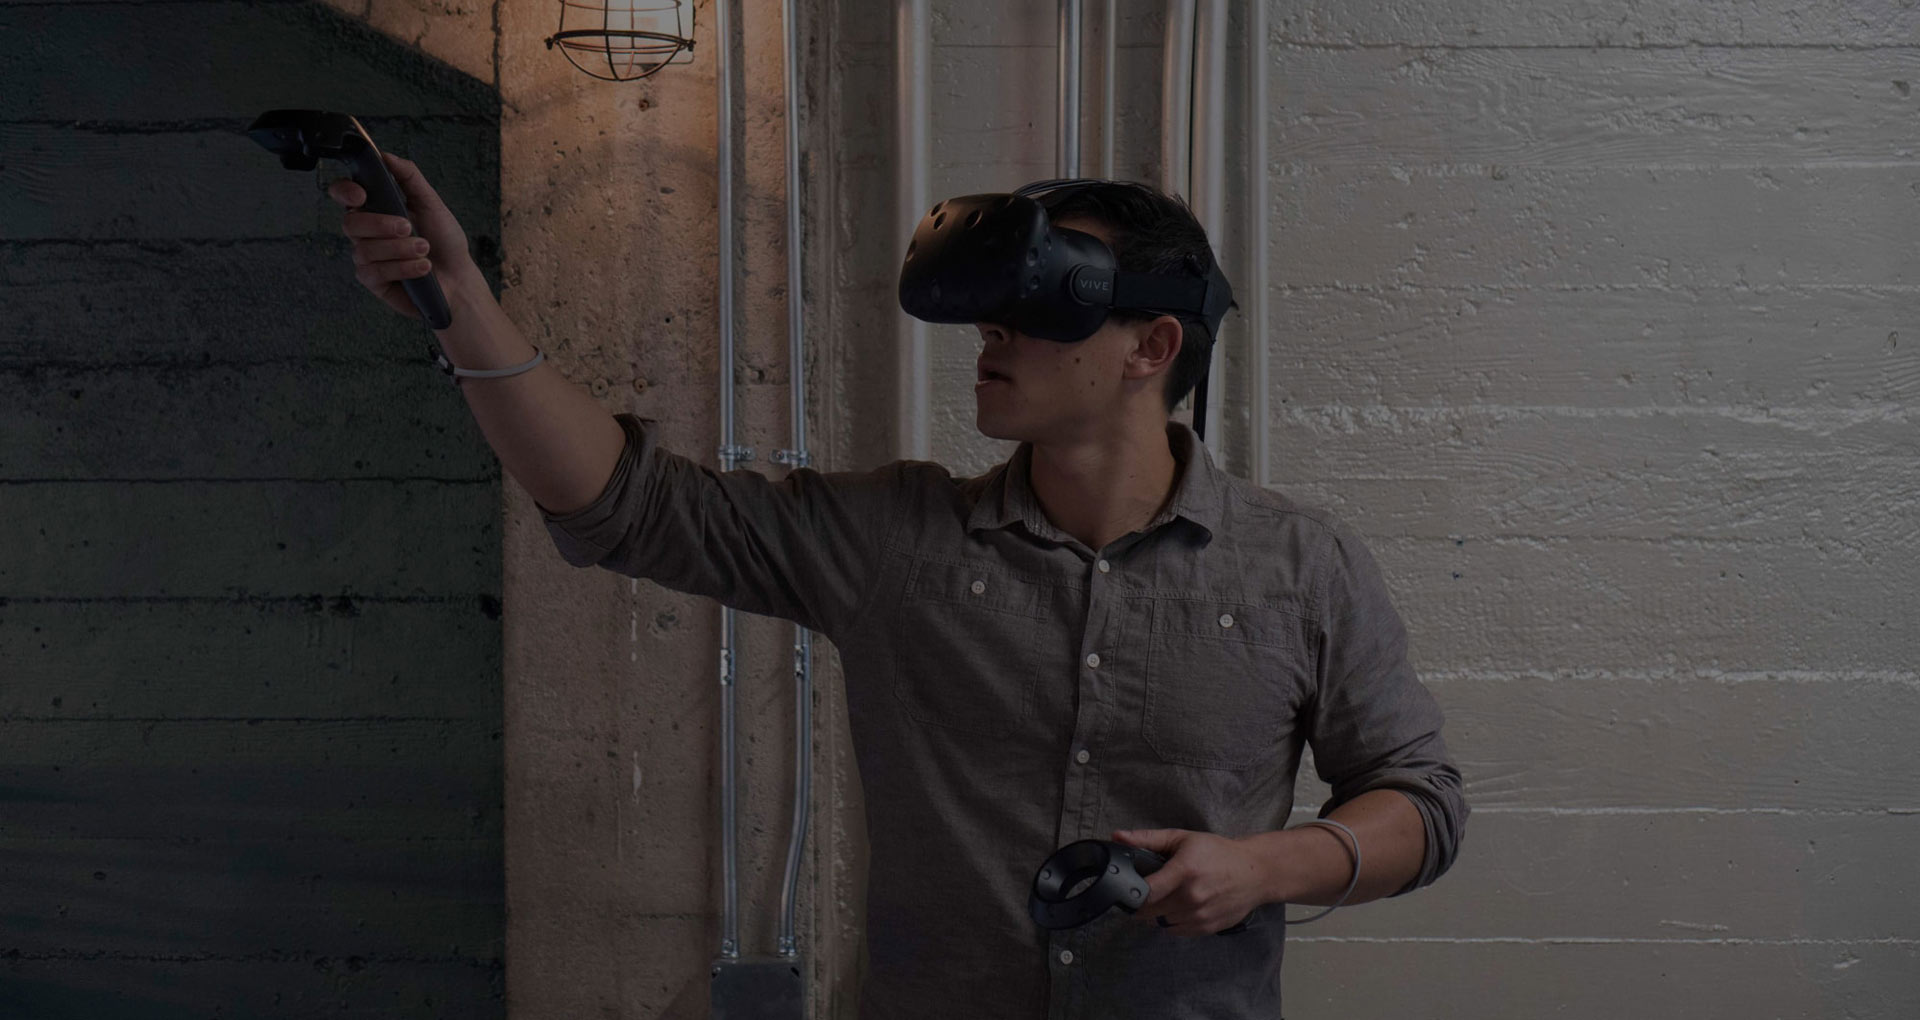
In a world overflowing with data, traditional 2D visualizations often fall short of capturing the complexities and nuances within. Augmented reality (AR) is emerging as a game-changer, offering a new dimension of data exploration that goes beyond flat screens and static charts in Excel, Tableau, and PowerBI. Imagine stepping into an immersive world where data points surround you, revealing patterns and insights previously hidden.
As noted in a recent review of AR and VR applications, these technologies “have the potential to revolutionize [industries] by providing immersive and interactive [experiences]” (Alizadehsalehi et al., 2024). This potential extends beyond specific use cases to encompass the broader landscape of data visualization and analysis, transforming how we interact with and understand complex information.
AR empowers users to interact with data in a more intuitive and immersive way, fostering a deeper understanding of complex relationships and trends. This transformative technology is not just changing the way we see data; it’s changing the way we understand it.
Top 5 Reasons to Build Data Visualizations and Analytics Capabilities into XR Experiences
1. Immersive 3D Data Representations
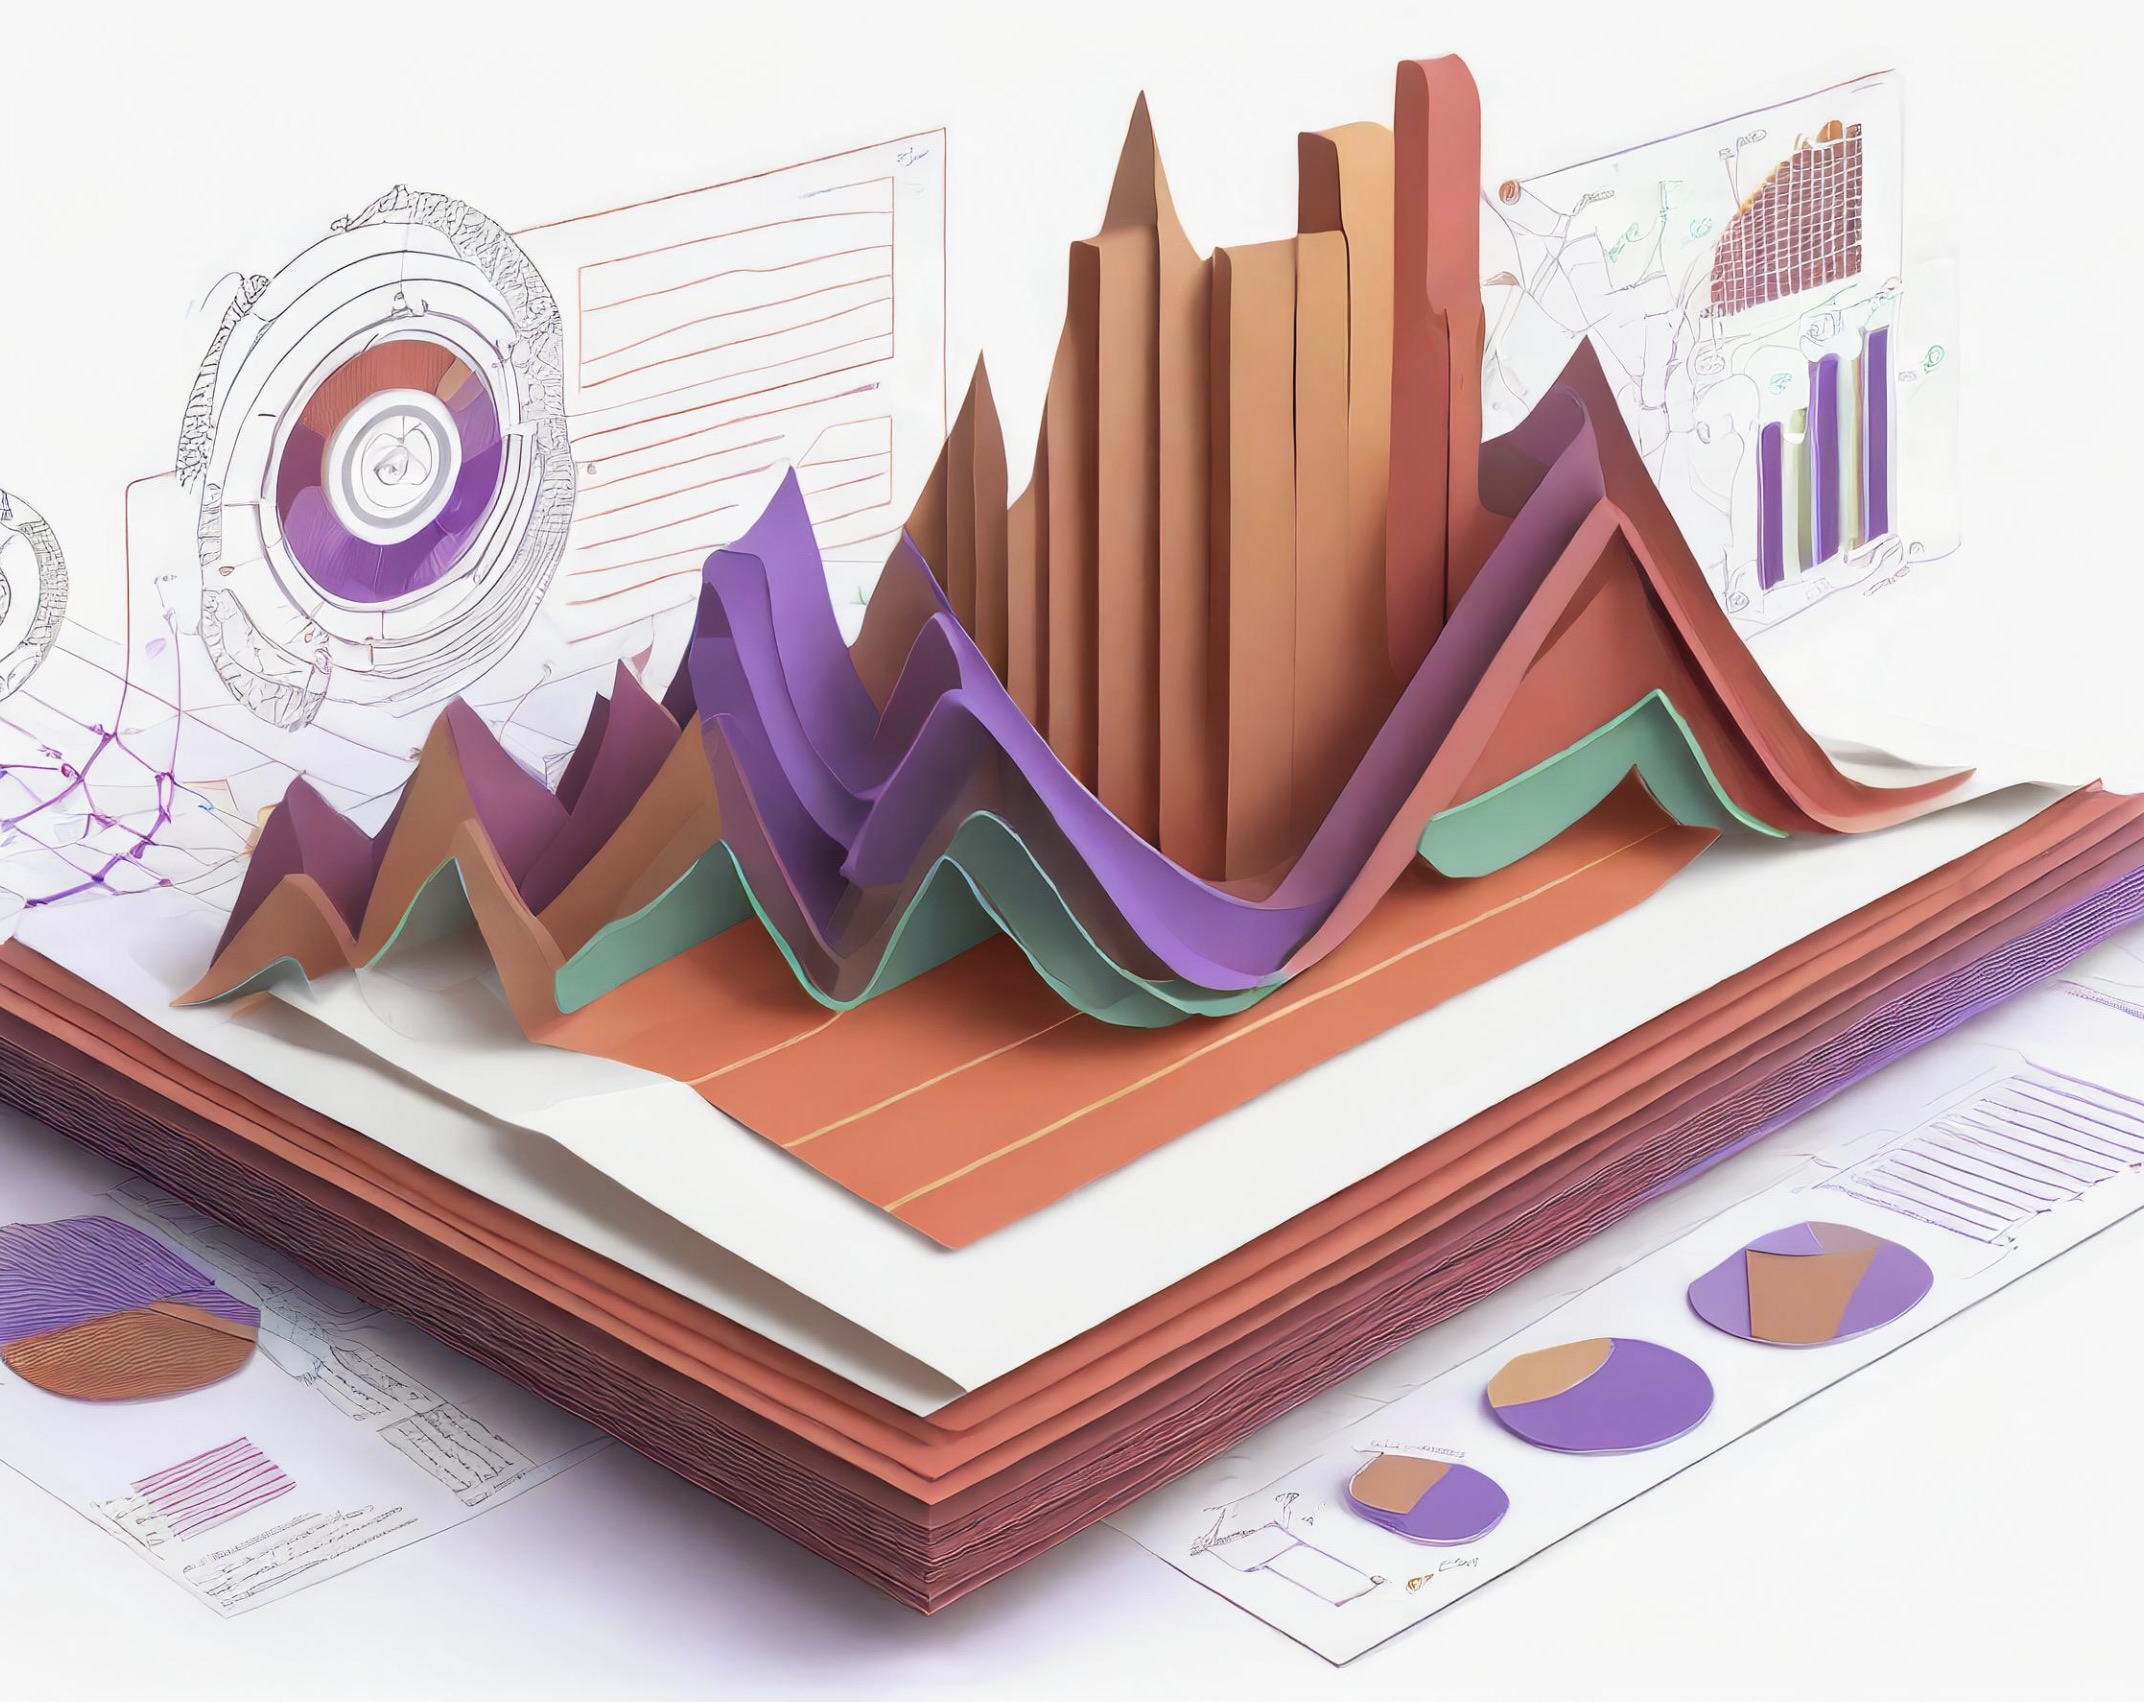
AR allows data to break free from the confines of 2D screens and traditional dashboards and reports, offering a depth and spatial context that enhances understanding. Imagine exploring a 3D model of a molecule, seeing the community impact of ESG efforts in a virtual town, walking through a virtual cityscape of demographic data, or manipulating a holographic financial forecast.
2. Real-Time Data Updates
AR visualizations can be dynamically updated, reflecting changes in the data in real-time. This is invaluable in fast-paced environments like finance, where stock market data can be overlaid on a trader’s physical surroundings, or in manufacturing, where factory floor data can be visualized in context to identify bottlenecks. It’s also crucial for organizations that are constantly evolving, not just during press releases and quarterly earnings.
3. Contextual Understanding
By superimposing data onto the real world, AR provides a deeper understanding of how data relates to its physical context. An architect can visualize a building design on its actual site, a doctor can see a patient’s medical data overlaid on their body during an exam, or a city planner can analyze traffic patterns on a virtual map of the city to optimize traffic light timing. The power of AR to enhance contextual understanding is particularly evident in industries like construction. As highlighted in a recent study, “AR can be used to overlay safety information onto the real-world environment, which can help workers to identify hazards and make informed decisions” (Alizadehsalehi et al., 2024). This ability to seamlessly integrate data with the physical world is a cornerstone of AR’s value proposition, not just in construction but across various sectors.
4. User Interaction
AR makes data tangible. Users can interact with data visualizations through natural gestures, voice commands, or touch, making it a more engaging and intuitive experience. This allows for deeper exploration, faster analysis, and more effective communication of insights. Through sound and haptics, the data responds, making the experience more memorable and impactful.
5. Collaboration
AR can facilitate collaboration among teams, even when they are geographically dispersed. Imagine multiple users interacting with the same AR visualization of a product prototype, each contributing their unique perspectives and insights to refine the design. This can lead to faster problem-solving and better decision-making.
Common Use Cases
The applications of AR in data visualization are vast and varied, spanning across industries:
Medical and Health Care
AR is revolutionizing healthcare by enabling a new level of precision, efficiency, and patient engagement.
- Surgical Visualization: Surgeons can use AR headsets to overlay a patient’s medical imaging data directly onto their field of view during operations, improving accuracy and reducing complications.
- Medical Training: AR offers immersive simulations that allow medical students and professionals to practice procedures and diagnoses in a safe environment, accelerating learning and improving skills retention.
- Patient Education and Engagement: Complex medical conditions and treatment plans can be transformed into interactive 3D visualizations that are easier for patients to understand, leading to increased comprehension and adherence to treatment.
- Physical Therapy and Rehabilitation: AR gamifies physical therapy exercises, making them more engaging and motivating. It also provides real-time feedback on movement and posture, helping patients recover faster.
Banking and Financial Services
AR is transforming the financial landscape by enabling deeper insights, enhanced decision-making, and streamlined processes across various sectors:
- Financial Analysis: Analysts can leverage AR to visualize complex financial data, such as market trends, portfolio performance, and risk assessments, in a more intuitive and immersive way. This can help them identify patterns, uncover hidden correlations, and make more informed investment decisions.
- Private Equity Due Diligence: Investment professionals can use AR to virtually explore a target company’s operations, facilities, and financials. This allows for a more comprehensive understanding of the business and its potential risks and opportunities, leading to more accurate valuations and better-informed investment decisions.
- Insurance Claims Processing: Claims adjusters can utilize AR to remotely assess damage to property or vehicles, overlaying relevant data and estimates onto the real-world environment. This can expedite claims processing, reduce fraud, and improve customer satisfaction.
- Customer Engagement: Financial institutions can create interactive AR experiences to educate customers about complex financial products and services. This can increase engagement, build trust, and ultimately drive customer acquisition and retention.
- Risk Assessment and Mitigation: AR can simulate various risk scenarios in a visual and interactive manner, allowing financial professionals to better understand potential threats and develop effective mitigation strategies.
Other Industries
- Architecture and Construction: Architects use AR to visualize building designs on their actual sites, ensuring accuracy and allowing clients to experience the design in its real-world context.
- Education: AR is revolutionizing education by allowing students to dissect a virtual frog or explore the solar system through interactive and immersive visualizations.
- Retail: Retailers like IKEA use AR to let customers visualize how furniture would look in their homes before buying.
- Manufacturing: Factory workers use AR to access real-time data on machine performance and receive step-by-step instructions, improving efficiency and reducing errors.
Product and Open Source Leaders
Platforms
Several companies are leading the way in building AR data visualization platforms, including:
- BadVR: A platform that uses AR to visualize complex datasets in 3D, enabling users to explore, analyze, and communicate insights in a more intuitive way.
- Flow Immersive: A web-based AR platform and app ecosystem that allows users to create and share interactive data visualizations.
Frameworks
Many of the frameworks and platforms used to produce Web AR experiences also provide data visualization components such as:
- Three.js: A popular JavaScript library for 3D graphics, ideal for rendering data visualizations in AR scenes.
- A-Frame: A web framework for building VR experiences that can also be adapted for AR. It simplifies the creation of 3D scenes and interactions.
Other frameworks for consideration include Deck.gl, a WebGL-powered framework for visual exploratory data analysis, well-suited for large datasets.
The Future of AR in Data Analysis
As Bernard Marr notes in his article “How VR and AR Will Change How We Visualise Data,” AR and VR technologies “open up data analytics to a broader user group than just data scientists.” This democratization of data analysis is a key trend that will shape the future of the field.
The future of AR in data analysis is promising. As technology continues to advance, we can expect even more immersive and sophisticated data visualization experiences. The potential applications are boundless, from predicting weather patterns to optimizing traffic flow, from designing personalized medicine to exploring the depths of space.
Augmented reality is not just changing the way we see data; it’s changing the way we understand it. By stepping into the data, we can unlock new insights, make better decisions, and create a more informed and empowered future.
At Fishermen Labs, we blend creativity and technology to craft immersive AR experiences that empower businesses to visualize complex data, drive workforce engagement, support impactful storytelling with clients.
Sources
- Alizadehsalehi, S., Hadavi, A., & Pour Rahimian, F. (2024). Augmented Reality and Virtual Reality Applications in Construction Safety: A Review. Automation in Construction, 164, 2468502X24000202.
- Marr, Bernard. “How VR and AR will change how we visualize data”. https://bernardmarr.com/how-vr-and-ar-will-change-how-we-visualise-data/